|
Performance Data From A Micro Renewable Energy System Remote Monitoring Using A Radio Link |
|
The radio link from the field to the shop utilizes a FreeWave FGR radio system. It is a commercial radio system and was used because I had a pair of them in my Ham Radio recycle box. Ultimately they will be replaced with re-cycled MDS radios as I have a number of these radios and only two of the FreeWave radios. The radios are easy to set up, use an RS-232 interconnection and essentially work right out of the box. I had only one minor problem with the interface to the Arduino which was easy to fix. The output from pin 1 (TX output) on the Arduino is inverted from what the FreeWave radio requires. I wired in a 4001 as an inverter and everything worked. Power for the 4001 came from the Arduino while power for the radio was from the battery bank. I have the Arduino transmitting data every 2.5 seconds and will continue with this while I evaluate the system. |
|
FreeWave FGR Radio |
|
40 minutes of data from the wind turbine. Data recorded every 2.5 seconds |
|
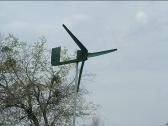
As I installed the radio in the field I collected about 40 minutes of data on the wind turbine. It was not a very windy day so I did not expect great output from the wind turbine and the chart to the right confirms this. Today, the main charge current for the batteries came from the solar panel.
As in the previous data collection exercise, the majority of the time data was being recorded the wind turbine output was not sufficient to charge the batteries. |
|
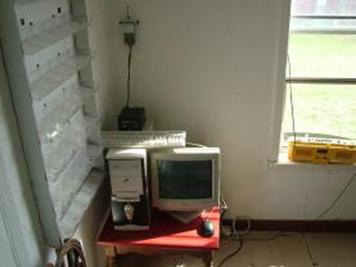
The recording computer is located in the shop area of the farm with a 12 VDC power supply and the FreeWave Radio mounted on the wall. The next addition will be to incorporate a wireless card so that we can link the data to the Internet. |
|
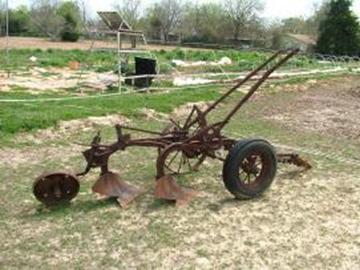
Not all technology at the farm is High Tech |
|
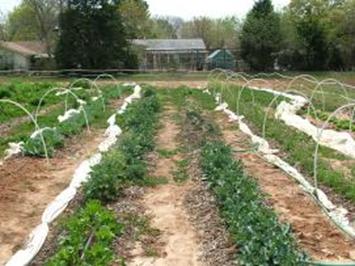
This is why we have a renewable energy system. These plants would not grow like this if we did not have an irrigation system |
|
Performance data is now being recorded and will be evaluated each week. Once the boost converter is installed, I will publish more charts on the actual performance of the system.
If anyone is recording data from a Micro Wind System I would like to speak with them. |
|
The addition of a 4001 gate to invert the data from the Arduino TX pin. This allows data to be sent over the FreeWave radio |
|
FreeWave Radio |
|
4001 |
|
The chart to the right was collected during a subsequent visit to the farm and again shows the interaction between the solar and wind system on the batteries.
The day started overcast with strong wind gusts. These weather conditions are reflected in the output from the solar panels and the wind turbine. As the sun came out, the output from the solar panel improved. The wind continued to come in gusts and consequently the output from the wind turbine was not constant. |
|
This graph once again, shows that much of the output from the wind turbine is lost energy because it is not turning fast enough.
Using these few initial observations, I can conclude that it will be possible to analyze blade designs once we have enough historical data to compare a new design against. As I noted earlier, the blade construction was not very scientifically accomplished. I had no real idea what I was doing when I shaped the blades and no real way, until now, to actually measure their efficiency. I used PVC for the blades because it was quick and easy but in choosing this material I was limited as to what I was able to do in forming the blades. The size of the PVC and the width of the cut I made to form the blade were all pretty much arbitrary and based on designs I found on the internet.
Therefore, one of the important studies I plan is to try different blade configurations to see if, over time, these improve the output from the turbine. Many manufacturers claim that their blades have a lower cut in but there does not seem to be any actual data presented to confirm these claims. My goal is to provide an inexpensive design that can be replicated with simple hand tools. Therefore, I expect that some compromise will be necessary but at least there will be data to back up any design I finally settle on.
· A second consideration is to see what improvements a ten foot mast extension will make in turbine output performance. My original design was for a 20 ft. mast but at the time we erected the turbine, we lacked the necessary pipe fittings. Therefore, before we change the blades, we will add the next ten foot extension and take some more data on performance. When we have some historical data to compare performance against, I will install another set of blades to evaluate.
· A third study will be to incorporate a vertical axis turbine on the site and compare the performance from it.
· A fourth study will be to build a new turbine, using recycled hard drive magnets. This will be done on site and will be part of a Renewable Energy system workshop effort. |